Introducing Analytics Dashboard
We're thrilled to unveil our enhanced statistics platform that brings you deeper insights into your events' performance! Whether you're managing multiple events or focusing on a specific occasion, our new analytics dashboard gives you the complete picture of your success.
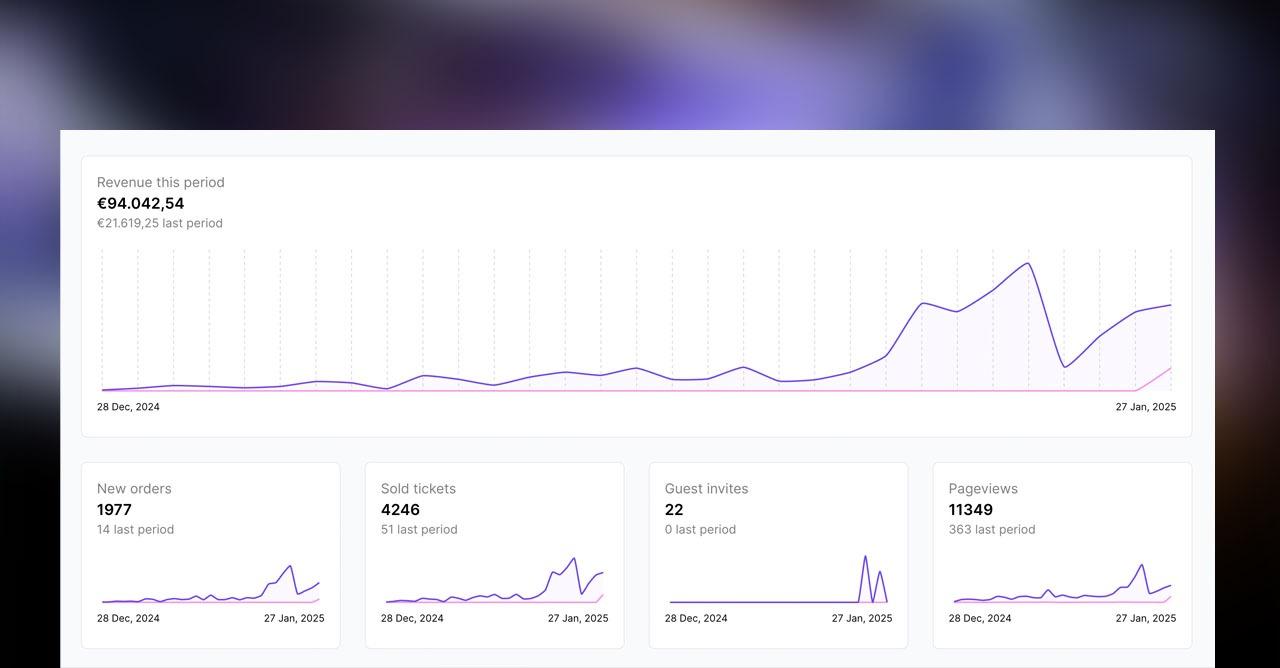
Compare and Grow 📈
Every number tells a story! Now you can instantly compare your current performance with previous periods. See how your events are growing, spot trends, and celebrate your progress. Whether it's revenue, ticket sales, or event views - you'll always know if you're on the right track.
Your Data, Your Way 🎯
Filter your statistics by date to zoom in on specific time periods. Want to analyze last month's performance? Or see how your summer events compared to spring? It's all just a click away. This powerful feature helps you:
- Track seasonal trends
- Measure campaign effectiveness
- Make data-driven decisions for future events
Organization-Wide or Event-Specific - You Choose 🔍
Get the full picture with organization-wide statistics or dive deep into individual event performance. Our new dashboard lets you seamlessly switch between:
- Total Revenue Overview
- Order Tracking
- Tickets Sold
- Guest Invitations
- Event Page Views
Every metric is carefully designed to give you actionable insights that help drive your event's success. From understanding your ticket sales patterns to tracking guest engagement, you'll have all the data you need to make informed decisions.
Real Numbers, Real Impact 💡
Watch your success unfold in real-time! Whether you're:
- Monitoring ticket sales during a launch
- Tracking visitor engagement
- Analyzing revenue growth
- Managing guest lists
The Dynamic Analytics Dashboard puts all these powerful insights at your fingertips, helping you make smarter decisions for your events.
Ready to dive into your event's performance story? Experience the power of informed decision-making with our enhanced statistics dashboard today! ✨